Relperm Driver
Introduction
Fitting relative permeability parameters to experimental or benchmark data often should not require a full flow simulation, when the only goal is to check that the relative permeability curves respond correctly to changes in phase saturation. As such, GEOS provides a RelpermDriver allowing the user to test relative permeability models for a well-defined sweep of saturation conditions. The driver itself is launched like any other GEOS simulation, but with a particular XML structure:
./bin/geosx -i myRelpermTest.xml
This driver will work for any 2-phase or 3-phase relative permeability model enabled within GEOS.
XML Structure
A typical XML file to run the driver will have several key elements. Here, we will walk through an example file included in the source tree at:
inputFiles/constitutiveDriver/testRelperm_docExample.xml
A key point is that the XML file follows the same structure as a typical GEOS input deck. As with the other constitutive drivers, once the constitutive block has been calibrated, solver and discretization sections can be added directly to transform it into a full field simulation setup. This continuity allows for smooth transitions between calibration and simulation workflows.
The first step is to define a parameterized relative permeability model to test. Here, we create particular types of table-based two-phase relative permeabilities for sandstone, one standard and one with hysteresis:
  <Constitutive>
    <TableRelativePermeability
      name="sandstone"
      phaseNames="{ gas, water }"
      wettingNonWettingRelPermTableNames="{ waterRelPerm, gasRelPermDrainage }" />

    <TableRelativePermeabilityHysteresis
      name="sandstone_hysteresis"
      phaseNames="{ gas, water }"
      drainageWettingNonWettingRelPermTableNames="{ waterRelPerm, gasRelPermDrainage }"
      imbibitionNonWettingRelPermTableName="gasRelPermImbibition"
      imbibitionWettingRelPermTableName="waterRelPerm" />
  </Constitutive>
We also define the underlying table functions used by the model.
    <TableFunction
      name="waterRelPerm"
      coordinates="{ 0.15, 0.2095, 0.269, 0.3285, 0.3965, 0.456, 0.5155, 0.575, 0.6345, 0.694, 0.7535, 0.8215, 0.881, 0.9405, 1 }"
      values="{ 0, 0, 0.0001, 0.0007, 0.0036, 0.0105, 0.0242, 0.0483, 0.087, 0.1454, 0.2291, 0.3643, 0.5251, 0.7341, 1 }"
      interpolation="linear" />

    <TableFunction
      name="gasRelPermDrainage"
      coordinates="{ 0, 0.0595, 0.119, 0.1785, 0.2465, 0.306, 0.3655, 0.425, 0.4845, 0.544, 0.6035, 0.6715, 0.731, 0.7905, 0.85 }"
      values="{ 0, 0.0035, 0.0142, 0.0319, 0.0608, 0.0936, 0.1336, 0.1806, 0.2347, 0.2959, 0.3642, 0.4509, 0.5344, 0.6249, 0.64 }"
      interpolation="linear" />

    <TableFunction
      name="gasRelPermImbibition"
      coordinates="{ 0.0, 0.25, 0.31, 0.37, 0.43, 0.49, 0.55, 0.61, 0.67, 0.73, 0.79, 0.85 }"
      values="{ 0.0, 0.0, 0.00160761, 0.00974671, 0.02797018, 0.05909299, 0.10556063, 0.16957945, 0.25318320, 0.35827288, 0.48664302, 0.64 }"
      interpolation="linear" />
A RelpermDriver is then added as a Task, a particular type of executable event often used for simple actions.
  <Tasks>
    <RelpermDriver
      name="test_sandstone"
      relperm="sandstone"
      steps="16"
      phaseNames="{ gas }"
      saturationControls="{ gasSaturation }"
      logLevel="1" />
    <RelpermDriver
      name="test_sandstone_hysteresis"
      relperm="sandstone_hysteresis"
      output="test_relperm_sandstone_hysteresis.txt"
      steps="80"
      phaseNames="{ gas }"
      saturationControls="{ gasSaturationHysteresis }"
      logLevel="1" />
  </Tasks>
The driver itself takes as input the relative permeability model (referenced by the relperm parameter). The model is evaluated over time increments defined by the steps parameter, while the saturations at each step are evaluated using functions provided in the saturationControls array. Results will be written in a simple ASCII table format to a specified file if an output parameter is provided; otherwise, it is written to the standard log.
The driver task is added as a SoloEvent to the event queue.
    <SoloEvent
      name="test_sandstone_event"
      target="/Tasks/test_sandstone" />
    <SoloEvent
      name="test_sandstone_hysteresis_event"
      target="/Tasks/test_sandstone_hysteresis" />
Parameters
The key XML parameters for the RelpermDriver are summarized in the following table:
XML Element: RelpermDriver
Name |
Type |
Default |
Description |
|---|---|---|---|
logLevel |
integer |
0 |
Sets the level of information to write in the standard output (the console typically).
Information output from lower logLevels is added with the desired log level
1
- Enable log output
|
name |
groupName |
required |
A name is required for any non-unique nodes |
output |
string |
Output file |
|
phaseNames |
string_array |
required |
The names of the phases for which saturations are defined |
precision |
integer |
4 |
The precision to use to data out to files |
relperm |
groupNameRef |
required |
Relative permeability model to test |
saturationControls |
string_array |
required |
Functions controlling saturation time history of the selected phases |
steps |
integer |
required |
Number of steps to take |
Saturation Assignment
The phase saturations are explicitly driven by user-defined functions over time.
To configure the driver, the user must specify a list of target phases via phaseNames and corresponding time-history functions via saturationControls. For an $N$-phase model, exactly $N-1$ phases and saturation functions must be provided. The saturation of the remaining implicit phase is calculated automatically by the driver to ensure the phase volume fractions (saturations) always sum to exactly 1.0.
During execution, the driver evaluates the provided functions at each step. To ensure physical validity: * If a saturation function evaluates to a negative value at a given step, the saturation is clamped to zero. * If the evaluated saturations sum to a value greater than 1.0, they are proportionally scaled down so that their collective sum equals 1.0, and the implicit phase is assigned a saturation of zero.
Examples and Hysteresis
The documentation example contains two distinct driver tests that showcase different saturation trajectories:
Standard Relperm Test (``test_sandstone``): This test evaluates a standard relative permeability model. The gas saturation is driven by the
gasSaturationfunction, which simply increases linearly from 0.0 to 1.0 over the evaluation time.Hysteresis Relperm Test (``test_sandstone_hysteresis``): This test evaluates a hysteresis-enabled model and requires a non-monotonic saturation path to test historical tracking. It uses the
gasSaturationHysteresisfunction, which dynamically varies the gas saturation: rising from 0.0 to 0.4 (primary drainage), dropping to 0.3 (imbibition), rising again to 0.6 (secondary drainage), and finally dropping to 0.4 (secondary imbibition).
These saturation functions are explicitly defined in the XML as shown below:
    <TableFunction
      name="gasSaturation"
      coordinates="{ 0.0, 1.0 }"
      values="{ 0.0, 1.0 }"
      interpolation="linear" />

    <TableFunction
      name="gasSaturationHysteresis"
      coordinates="{ 0.0, 1.0, 2.0, 3.0, 4.0 }"
      values="{ 0.0, 0.4, 0.3, 0.6, 0.4 }"
      interpolation="linear" />
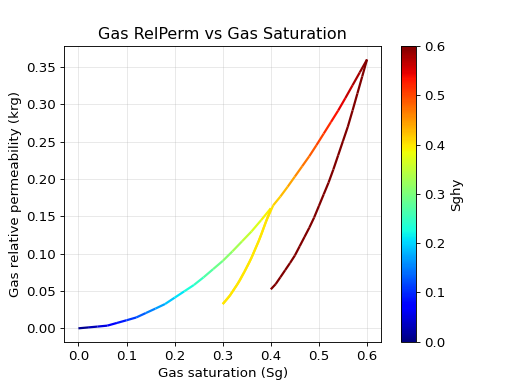
Output of the test_sandstone_hysteresis task. The plotted trajectory follows the defined gasSaturationHysteresis values { 0.0, 0.4, 0.3, 0.6, 0.4 }. The color scale indicates the internally tracked maximum historical gas saturation (Sghy), dictating the departure curves:
Primary Drainage (0.0 to 0.4): Sghy updates alongside the current saturation (dark blue to yellow).
Primary Imbibition (0.4 to 0.3): The curve drops from the main envelope; Sghy remains constant at 0.4 (yellow).
Secondary Drainage (0.3 to 0.6): The curve climbs back up, with Sghy resuming updates past 0.4 until it hits 0.6 (dark red).
Secondary Imbibition (0.6 to 0.4): The relative permeability drops along a new, lower path, while Sghy stays fixed at 0.6 (dark red).
Output Format
The output key is used to identify a file to which the results of the simulation are written. If this key is omitted, file output will be suppressed and instead the resulting table will be output to the screen. When written to standard output, the data is written in a table format similar to the one below.
---------------------------------------------------------------------------------
|                           Output for test_sandstone                           |
|-------------------------------------------------------------------------------|
|     index     |          saturation           |            relperm            |
|---------------|-------------------------------|-------------------------------|
|               |      gas      |     water     |      gas      |     water     |
|---------------|---------------|---------------|---------------|---------------|
|   0.0000e+00  |   0.0000e+00  |   1.0000e+00  |   0.0000e+00  |   1.0000e+00  |
|   1.0000e+00  |   3.9525e-02  |   9.6047e-01  |   2.3250e-03  |   8.2337e-01  |
|   2.0000e+00  |   7.9050e-02  |   9.2095e-01  |   7.0157e-03  |   6.6543e-01  |
|   3.0000e+00  |   1.1857e-01  |   8.8143e-01  |   1.4124e-02  |   5.2659e-01  |
---------------------------------------------------------------------------------
When written to a file, the file is a simple ASCII format with a brief header followed by the actual saturation data. An example is shown below.
# column 1 = index
# column 2 = saturation,gas
# column 3 = saturation,water
# column 4 = relperm,gas
# column 5 = relperm,water
 0.0000e+00 1.0000e+00 0.0000e+00 1.0000e+00 0.0000e+00
 2.0000e-01 8.0000e-01 2.0000e-01 7.0006e-01 7.1429e-04
 4.0000e-01 6.0000e-01 4.0000e-01 4.4233e-01 1.5671e-02
 6.0000e-01 4.0000e-01 6.0000e-01 2.3163e-01 9.8057e-02
 8.0000e-01 2.0000e-01 8.0000e-01 7.6686e-02 3.6119e-01
 1.0000e+00 0.0000e+00 1.0000e+00 0.0000e+00 1.0000e+00
The exact number of columns will depend on the phase count configured in the chosen model. If hysteresis is activated on the model, additional columns tracking historical extremum saturations will automatically be present between the instantaneous saturations and the calculated relative permeabilities. This file can be readily plotted using any number of plotting tools. Each row corresponds to one timestep of the driver, starting from initial conditions in the first row.